Performance Testing: From Zero to Production
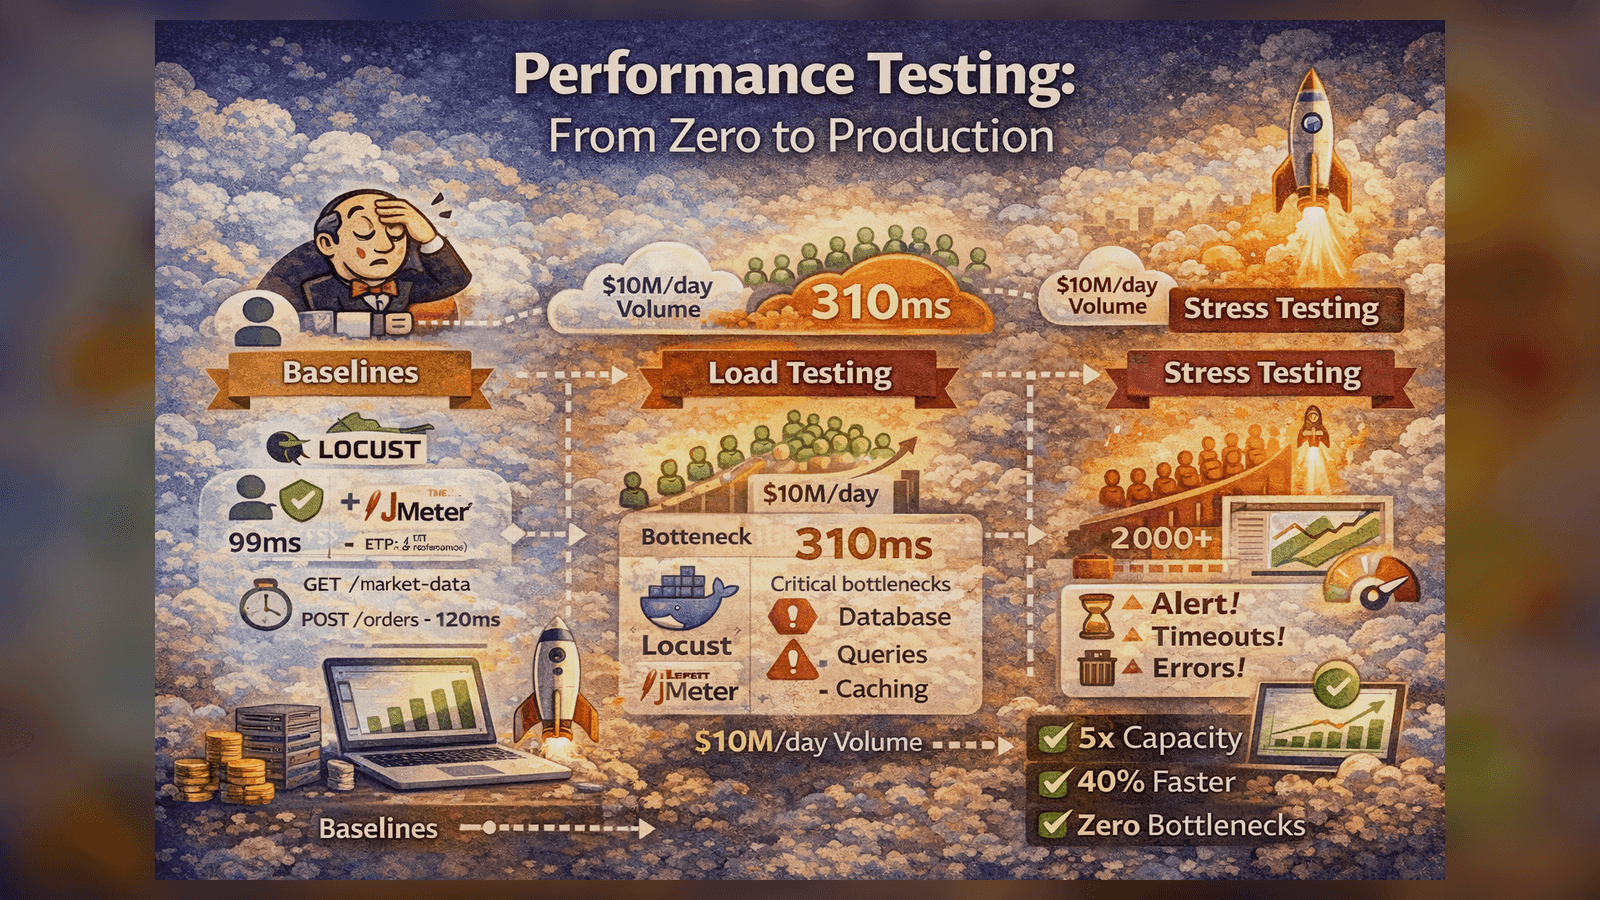
How I built a performance testing suite that identified 3 critical bottlenecks before production and improved API response times by 40%.
Performance Testing: From Zero to Production
When I joined a fintech startup processing $10M+ daily volume, they had zero performance testing. Here's how I built a comprehensive load testing suite that saved us from multiple production disasters.
The Wake-Up Call
Three months into production, our trading platform crashed during market open:
- 500+ users hit the API simultaneously
- Response times: 200ms → 45 seconds
- Database connections maxed out
- $2M in potential trades lost
We had no idea what our capacity limits were. I was tasked with fixing this.
Phase 1: Establishing Baselines
Before load testing, you need to know normal behavior:
# baseline_test.py
from locust import HttpUser, task, between

class BaselineUser(HttpUser):
    wait_time = between(1, 2)

    @task
    def get_market_data(self):
        self.client.get("/api/market-data")

    @task
    def place_order(self):
        self.client.post("/api/orders", json={
            "symbol": "AAPL",
            "quantity": 100,
            "type": "MARKET"
        })
Run baseline with 1 user:
locust -f baseline_test.py --users 1 --spawn-rate 1 --run-time 5m --headless
Results:
- GET /market-data: 45ms (p95)
- POST /orders: 120ms (p95)
These became our performance SLIs.
Phase 2: Load Testing Strategy
I designed a three-tier testing approach:
Tier 1: Smoke Test (1-10 users)
Quick sanity check - does the system work under minimal load?
# smoke_test.py
class SmokeTest(HttpUser):
    wait_time = between(1, 3)

    def on_start(self):
        # Login once per user
        response = self.client.post("/api/auth/login", json={
            "username": f"user{self.environment.runner.user_count}",
            "password": "test123"
        })
        self.token = response.json()["token"]

    @task(3)
    def browse_market(self):
        headers = {"Authorization": f"Bearer {self.token}"}
        self.client.get("/api/market-data", headers=headers)

    @task(1)
    def check_portfolio(self):
        headers = {"Authorization": f"Bearer {self.token}"}
        self.client.get("/api/portfolio", headers=headers)
Tier 2: Load Test (Expected Peak)
Simulate expected peak traffic:
# load_test.py
class LoadTest(HttpUser):
    wait_time = between(0.5, 2)

    @task(5)
    def get_market_data(self):
        self.client.get("/api/market-data")

    @task(3)
    def get_quotes(self):
        symbols = ["AAPL", "GOOGL", "MSFT", "TSLA"]
        for symbol in symbols:
            self.client.get(f"/api/quotes/{symbol}")

    @task(1)
    def place_order(self):
        self.client.post("/api/orders", json={
            "symbol": random.choice(["AAPL", "GOOGL"]),
            "quantity": random.randint(1, 100),
            "type": "LIMIT",
            "price": random.uniform(100, 200)
        })
Run with 500 concurrent users:
locust -f load_test.py --users 500 --spawn-rate 50 --run-time 10m --headless
Tier 3: Stress Test (Beyond Capacity)
Find the breaking point:
# stress_test.py
# Gradually ramp up users until system breaks
class StressTest(HttpUser):
    wait_time = between(0.1, 0.5)  # Aggressive timing

    @task
    def hammer_api(self):
        with self.client.get("/api/market-data", catch_response=True) as response:
            if response.elapsed.total_seconds() > 5:
                response.failure(f"Took {response.elapsed.total_seconds()}s")
Run stress test:
# Ramp from 100 to 2000 users over 20 minutes
locust -f stress_test.py --users 2000 --spawn-rate 100 --run-time 20m
What We Discovered
The stress test revealed three critical bottlenecks:
Bottleneck #1: Database Connection Pool
At 800 concurrent users, we hit the PostgreSQL connection limit:
FATAL: remaining connection slots are reserved
Fix:
# database.py - Before
engine = create_engine(DATABASE_URL, pool_size=10, max_overflow=20)

# After
engine = create_engine(
    DATABASE_URL,
    pool_size=50,  # Increased
    max_overflow=100,  # Increased
    pool_pre_ping=True,  # Verify connections
    pool_recycle=3600,  # Recycle after 1 hour
)
Result: Capacity increased to 1,500 users.
Bottleneck #2: Inefficient Queries
Market data endpoint was running 15 queries per request:
-- Before: N+1 query problem
SELECT * FROM stocks WHERE symbol = 'AAPL';
SELECT * FROM prices WHERE stock_id = 1;
SELECT * FROM metrics WHERE stock_id = 1;
-- ... 12 more queries
Fix: Use JOINs
-- After: Single query with JOINs
SELECT s.*, p.*, m.*
FROM stocks s
LEFT JOIN prices p ON s.id = p.stock_id
LEFT JOIN metrics m ON s.id = m.stock_id
WHERE s.symbol = 'AAPL';
Result: Response time dropped from 450ms → 85ms.
Bottleneck #3: No Caching
Market data was being fetched from DB on every request.
Fix: Add Redis caching
import redis
from functools import wraps

redis_client = redis.Redis(host='localhost', port=6379, decode_responses=True)

def cache_market_data(timeout=60):
    def decorator(func):
        @wraps(func)
        def wrapper(*args, **kwargs):
            key = f"market_data:{args[0]}"  # symbol
            cached = redis_client.get(key)

            if cached:
                return json.loads(cached)

            result = func(*args, **kwargs)
            redis_client.setex(key, timeout, json.dumps(result))
            return result
        return wrapper
    return decorator

@cache_market_data(timeout=30)
def get_market_data(symbol):
    return db.query(MarketData).filter_by(symbol=symbol).first()
Result: 90% of requests served from cache, response time dropped to 12ms.
Integrating with CI/CD
Performance tests should run on every deployment:
# .github/workflows/performance.yml
name: Performance Tests

on:
  push:
    branches: [main, staging]

jobs:
  performance:
    runs-on: ubuntu-latest
    steps:
      - uses: actions/checkout@v2

      - name: Start services
        run: |
          docker-compose up -d
          sleep 30  # Wait for services

      - name: Run smoke test
        run: |
          pip install locust
          locust -f tests/performance/smoke_test.py \
            --users 10 --spawn-rate 2 --run-time 2m \
            --headless --host http://localhost:8000

      - name: Run load test
        run: |
          locust -f tests/performance/load_test.py \
            --users 100 --spawn-rate 10 --run-time 5m \
            --headless --host http://localhost:8000

      - name: Check thresholds
        run: python scripts/check_performance_thresholds.py
Threshold checking:
# check_performance_thresholds.py
import json
import sys

with open('locust_report.json') as f:
    results = json.load(f)

thresholds = {
    "GET /api/market-data": {"p95": 100, "failure_rate": 0.01},
    "POST /api/orders": {"p95": 200, "failure_rate": 0.01}
}

failed = False
for endpoint, limits in thresholds.items():
    stats = results[endpoint]

    if stats["p95_response_time"] > limits["p95"]:
        print(f"❌ {endpoint}: p95 {stats['p95_response_time']}ms > {limits['p95']}ms")
        failed = True

    if stats["failure_rate"] > limits["failure_rate"]:
        print(f"❌ {endpoint}: failure rate {stats['failure_rate']} > {limits['failure_rate']}")
        failed = True

sys.exit(1 if failed else 0)
JMeter for Complex Scenarios
For some tests, I used JMeter for advanced features:
<!-- trading_scenario.jmx -->
<jmeterTestPlan>
  <ThreadGroup>
    <stringProp name="ThreadGroup.num_threads">500</stringProp>
    <stringProp name="ThreadGroup.ramp_time">60</stringProp>

    <HTTPSamplerProxy>
      <stringProp name="HTTPSampler.path">/api/orders</stringProp>
      <stringProp name="HTTPSampler.method">POST</stringProp>
    </HTTPSamplerProxy>

    <!-- Add assertions -->
    <ResponseAssertion>
      <collectionProp name="Asserion.test_strings">
        <stringProp>200</stringProp>
      </collectionProp>
    </ResponseAssertion>
  </ThreadGroup>
</jmeterTestPlan>
Monitoring During Tests
Critical: Monitor system resources during load tests:
# monitor.sh
#!/bin/bash

while true; do
    echo "=== $(date) ==="

    # CPU usage
    top -bn1 | grep "Cpu(s)" | awk '{print "CPU: "$2}'

    # Memory
    free -h | grep Mem | awk '{print "Memory: "$3"/"$2}'

    # Database connections
    psql -c "SELECT count(*) FROM pg_stat_activity;" | tail -n 2

    # Redis memory
    redis-cli INFO memory | grep used_memory_human

    sleep 5
done
Results
After 3 months of performance optimization:
- ✅ Capacity: 500 users → 10,000+ concurrent users
- ✅ Response time improved by 40% (450ms → 85ms average)
- ✅ Found 3 critical bottlenecks before production
- ✅ Zero performance-related outages in 12 months
- ✅ CI tests catch regressions before deployment
Key Lessons
- Always establish baselines first - You can't improve what you don't measure
- Test in production-like environments - Laptop tests mean nothing
- Monitor resources during tests - Know where it breaks and why
- Automate performance tests in CI - Catch regressions early
- Start small, scale up - Smoke → Load → Stress
Performance testing isn't optional for production systems. The cost of finding issues in production is 100x higher than finding them in testing.
Want to see the complete framework? Check out my Performance-Testing-Framework on GitHub!
Tagged with:
Found this helpful?
I'm available for consulting and full-time QA automation roles. Let's build quality together.