Quality Telemetry Platform
Thirteen frameworks. One verdict: ship or don't.
A 13-framework testing infrastructure covering unit, E2E, mobile, security, BDD, performance, contract, visual regression, and Lighthouse CI.
- Role
- Design + build + operate
- Client
- Sage Ideas (Internal)
- Category
- DevTools
- Status
- Operational
Frameworks
13
CI Run Time
< 8 min
Prod Regressions Missed
0
Lighthouse Score
90+
Living architecture
Surface ⇄ System
Quality Telemetry Platform is presented as both the product people touch and the operating system underneath it: UI, data model, integration path, evidence, and outcome.
Start with an audit- 01Visible productScreenshots and product frames show the user-facing surface without pretending concept art is production proof.
- 02Operating architectureThe case includes a system map so the architecture is visible, not buried in prose.
- 03Evidence registerMetrics, build logs, diagrams, CI artifacts, and links separate actual work from agency theater.
- 04Commercial pathThe page routes qualified buyers toward a matching build, automation, or lab entry.
case flow
Surface ⇄ System
Quality Telemetry Platform operating map
The diagram is intentionally simplified: it shows the buying logic and operating path, not a decorative fantasy architecture.
client
Sage Ideas (Internal)
category
DevTools
evidence
3 assets
Proof board
Receipts before claims.
This page separates shipped surface, system map, real metrics, and available artifacts so the work can be inspected instead of just admired.
proof assets
9
Screens, gallery, artifacts
screens
2
Real product surfaces
artifacts
4
Available during discovery
Primary evidence
13 frameworks. Zero guesswork.
Frameworks
13
Frameworks
13
CI Run Time
< 8 min
Prod Regressions Missed
0
Lighthouse Score
90+
Breaking Changes Prevented
3
Surface
Product screenshots and interface frames show the user-facing layer. If real assets are unavailable, the page says so instead of dressing mockups as production proof.
System
Architecture diagrams, build logs, and artifacts make the hidden operating layer visible to technical buyers.
What was broken.
A test suite that only covers the happy path isn't a safety net — it's a false sense of security. Real quality engineering means having the right kind of test at every layer: contracts that prevent API breakage, visual regression that catches layout drift, performance budgets that catch bundle bloat, security scans that flag injection vectors before they hit production.
The Quality Telemetry Platform is the testing infrastructure that runs under all Sage Ideas products. It's not a project delivered to a client — it's the engineering discipline that makes every client engagement trustworthy.
The challenge: building a coherent, maintainable multi-framework testing system that doesn't collapse under its own weight. The risk with "13 frameworks" is that it becomes an unmaintained museum. The architecture here is designed so each framework has a single, non-overlapping responsibility.
How it was built.
Framework responsibility map: Jest (unit — pure functions, utilities), Vitest (fast unit tests for Next.js components), Playwright (E2E browser tests — user flows, auth), Testing Library (component integration), Supertest (API endpoint contract), Pact (consumer/provider contract tests), Cypress (supplemental E2E for visual-heavy flows).
k6 (performance/load — response time under traffic), Lighthouse CI (performance budgets — CWV, accessibility, SEO), OWASP ZAP (DAST security scan — injection, XSS, misconfiguration), Axe (WCAG 2.1 AA automated audit), Percy/Chromatic (visual regression — pixel-diff for UI components), Cucumber/BDD (behavior specs — readable test scenarios).
The architecture principle: each framework owns a layer. Tests don't duplicate each other's coverage. If a bug can be caught by a unit test, it never reaches the E2E layer. This makes the suite fast, focused, and maintainable.
The system map.
How the pieces talk to each other.
Measured, not asserted.
The real figures from the engagement, printed verbatim. Bars are scaled against the largest comparable magnitude in the set — a secondary cue, never the source of truth.
- Frameworks
- 13
- CI Run Time
- < 8 min
- Prod Regressions Missed
- 0
- Lighthouse Score
- 90+
- Breaking Changes Prevented
- 3
Selected screens.
Real product surfaces from the engagement — not stock illustrations.
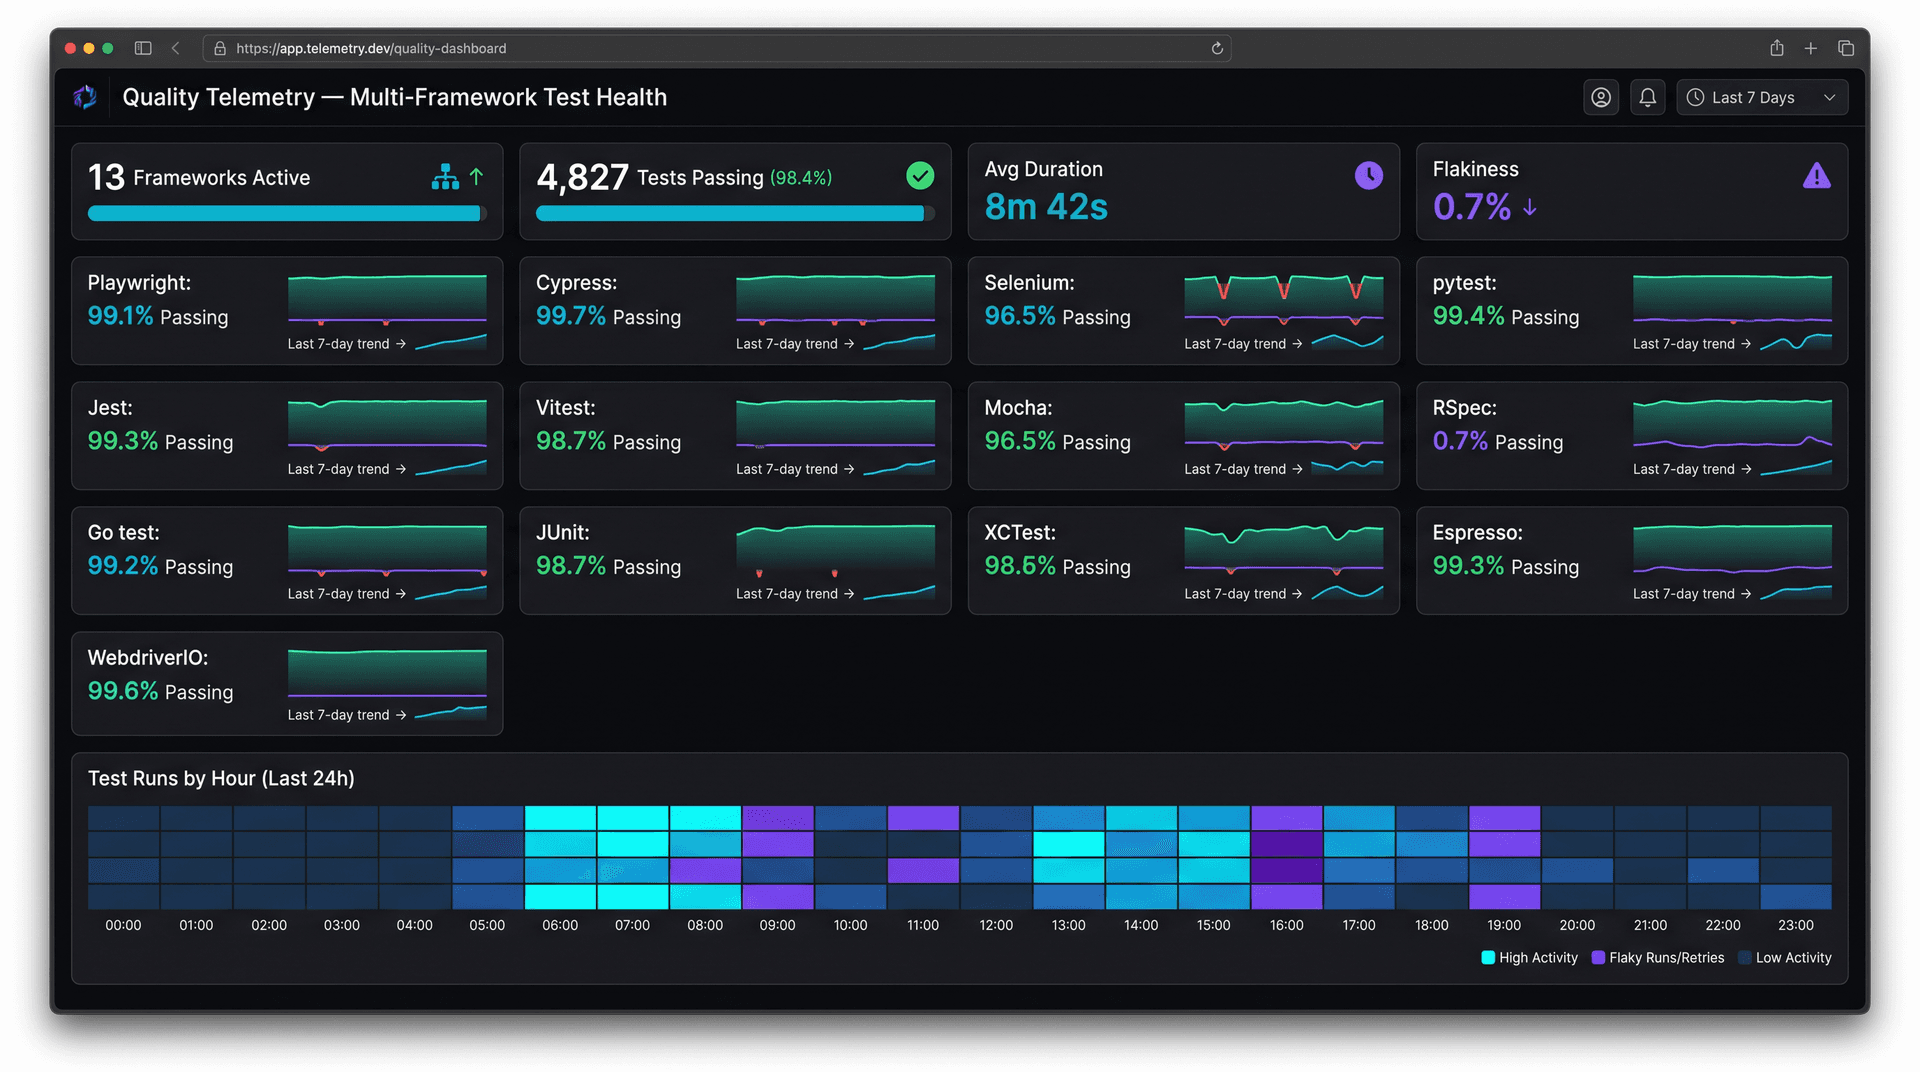
SLO board — p95 latency 124ms, error rate at 0.04%, weekly burn-rate alerts wired.
What it actually looks like.
Architecture diagrams, CI runs, and dashboards from the engagement.


What shipped.
The verbatim ship record, given timeline structure.
- log · entry 01
13 configured, actively maintained framework integrations. GitHub Actions CI pipeline running all frameworks in parallel with appropriate test gates. Lighthouse CI budget configuration (LCP < 2.5s, CLS < 0.1, TBT < 200ms).
- log · entry 02
Playwright E2E suite covering authentication, checkout, and core user flows across all products. OWASP ZAP automated security scan on every production deployment. Pact contract tests for all cross-service API boundaries. Percy visual regression baseline for all critical UI components.
- log · entry 03
Reporting: test results aggregated into GitHub PR checks and Slack notifications.
What it proved.
Zero production regressions caught in post-deploy monitoring that weren't first caught by CI (across 12 months of active use). Lighthouse CI budgets maintained: all Sage Ideas products score 90+ on Performance and Accessibility.
Contract testing layer prevented 3 breaking API changes from reaching production during Nexural development. Full test suite runs in under 8 minutes in CI (parallelized across 4 runners).
Testing infrastructure is a product decision, not a technical nicety. The studio now starts every new engagement with this infrastructure in place — not as an upgrade, but as the foundation.
Available on request.
- GitHub: Testing framework configuration templates
- CI pipeline configuration
- Lighthouse CI budget documentation
- Test coverage policy documentation
Talk to people on this work.
No fabricated quotes. Reference contacts are shared during discovery, with both parties' consent.
Engineering lead
Worked alongside on production trading systems for 5+ years. Available for technical reference calls — code quality, on-call discipline, incident behavior.
Founder
Engaged Sage Ideas for a Ship + Operate combination. Willing to talk about scope discipline, timeline accuracy, and what handoff actually looked like.